Ask E Source
About the Study
Sample selection and weighting
These data are drawn from 2021 through 2025 Claritas Energy Behavior Track annual surveys, conducted in partnership with E Source, in which approximately 32,500 residential customers in the US were surveyed on a variety of energy-related topics. The households were chosen from Survey Sampling International (SSI) and Critical Mix (now Dynata), which are leading providers of survey sampling solutions. Recent years included SaberEsPoder/Welcome Technologies and InnovateMR to recruit harder to reach populations. The survey has also been conducted annually since 2009, but this tool focuses only on results from the past five years of data (the study was paused in 2020 due to the COVID-19 pandemic).
The sample is nationally representative across the nine US census divisions, five US age groups, and three ethnicity and race groups. The data also includes between 500 and 1,500 Spanish-language responses per year. A postfieldwork weighting scheme was applied using geographic and demographic data. Note that some sample sizes are small; we cannot guarantee that analyzing data within a smaller area will elicit accurate results that can be generalized to that area’s population.
The utility-level data are based on respondents’ self-reported utility providers. Only utilities with at least 70 respondents in three out of the five survey years appear in the drop-down list. When base sizes fall below this threshold for a subset of respondents, results should be interpreted with caution.
Analysis
All statistical analysis was performed on the weighted sample to ensure that the results were as representative of the US population as possible. Percentages shown in the charts reflect weighted data; sample sizes (n) are based on unweighted data.
Statistical significance testing is available where differences in proportions for column variables are calculated at the 95% confidence level using a Z-test. Statistical significance is represented with the formula p < 0.05. The p-value allows us to assess whether the findings are significantly different from some reference value. For this study, a p-value that is less than 0.05 is the cutoff beyond which we assert that the findings are statistically significant. The statistical significance table shows statistically significant differences from other groups within the same row. Cells with dashes indicate that there are no statistically significant differences from other groups in that row. An asterisk (*) indicates that statistical significance testing was not conducted due to a small sample size.
Trends over time can be accessed within the tool when questions are similar within each survey iteration.
Understanding residential customers
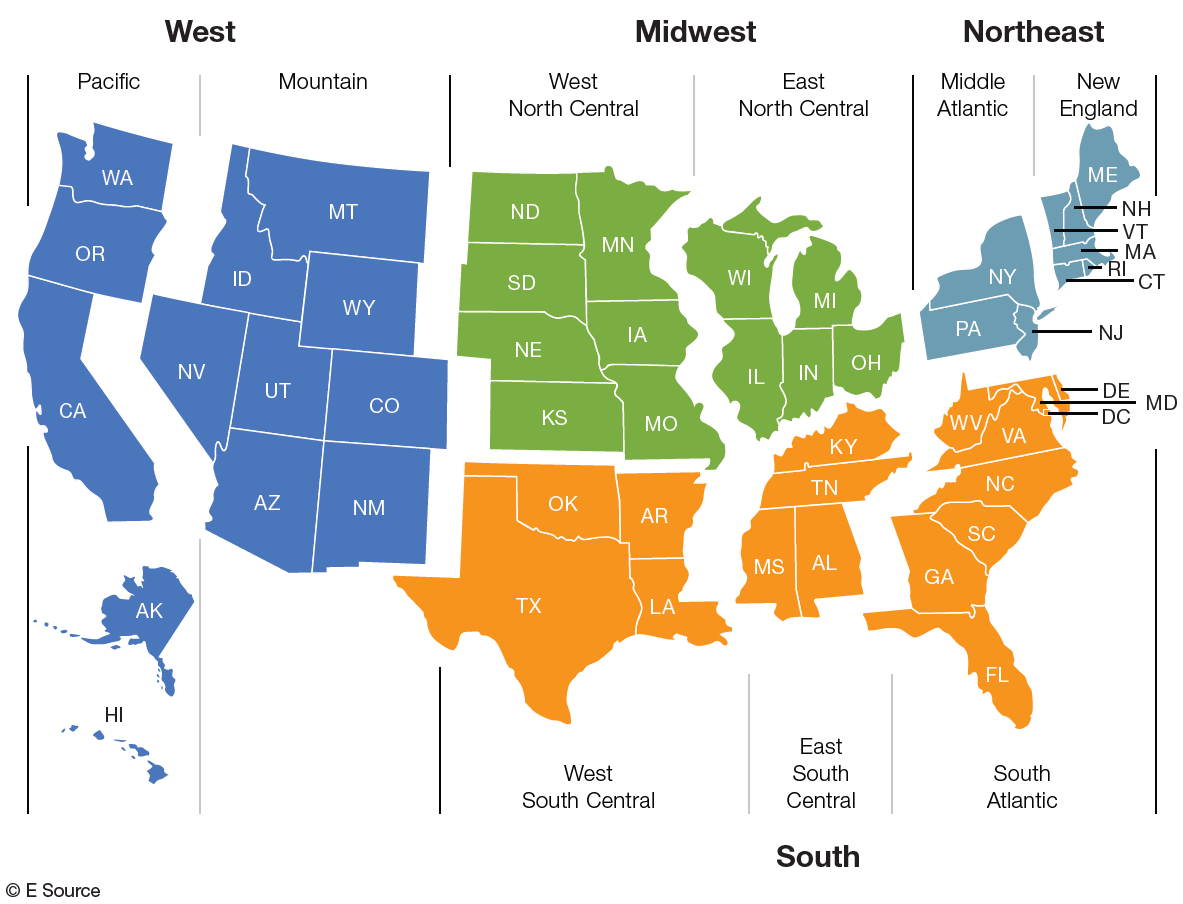
Who are your residential customers? How do they feel about energy efficiency, renewable energy, emerging technologies, smart meters, products and services, and their utility’s brand image? This large-scale survey from Claritas includes more than 300 variables and allows us to provide detailed data and analysis across US Census Regions (figure 1), demographics, household characteristics, energy profiles, and utility program participation.
Figure 1: US Census regions and divisions